Central
“Event counters”
It represents the total of solved and unsolved events (Image 8).
“Periodic scans result”
It is a counter (Image 8 ) which is based on device scans and highlights how many of them are:
- Secure.
- Protected.
- Compromised.
“Graph”
It is the graphic representation of resolved and unsolved security events (Image 8) (divided by
severity).
The mouseover on the graph will allow you to view the total of the elements on which the user is
focusing.
Filter
It is possible to filter the entire page by operating system by selecting the filter icon (Image 8).
 |
|---|
| Image 8 |
“Event list”
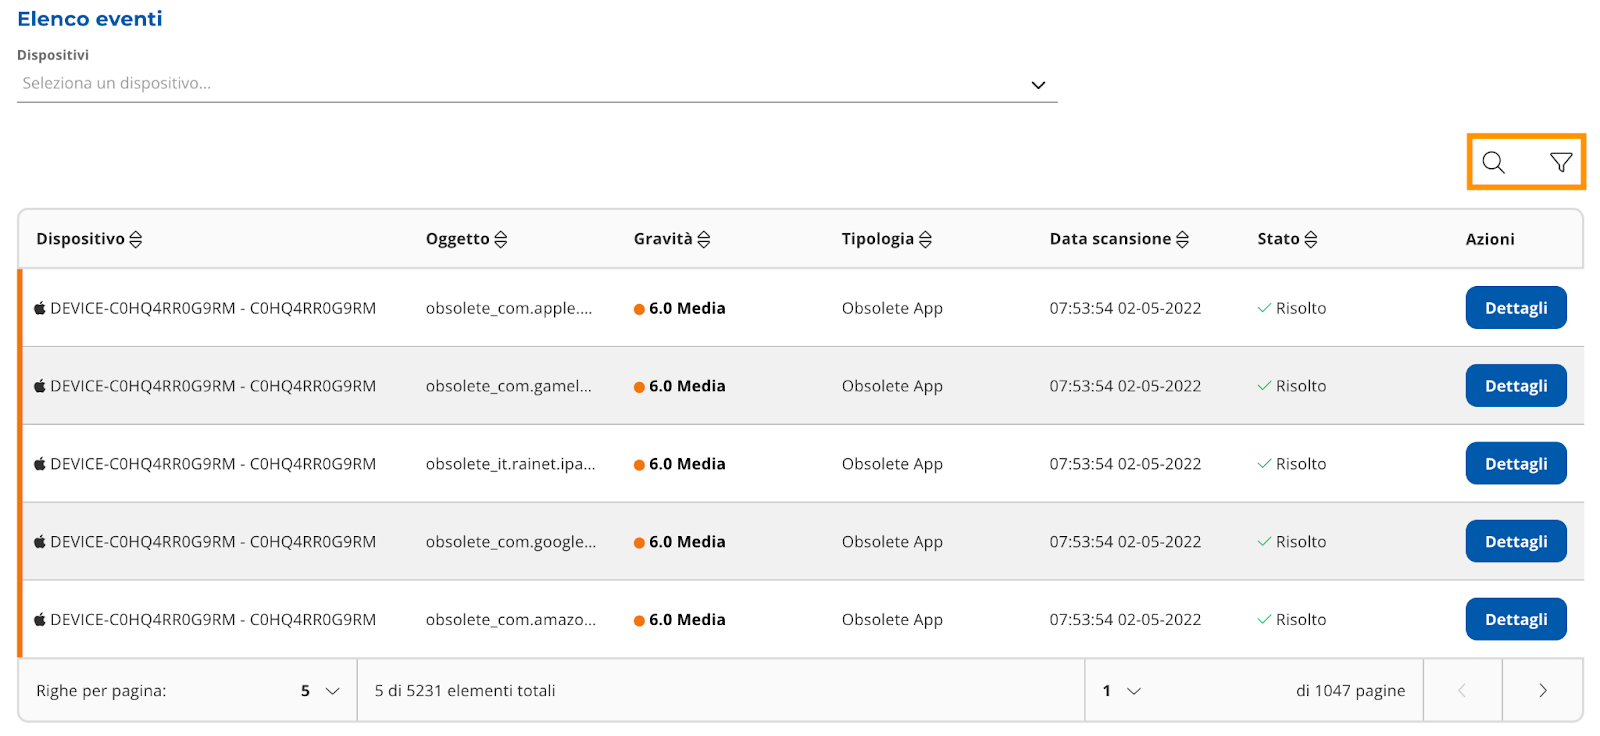
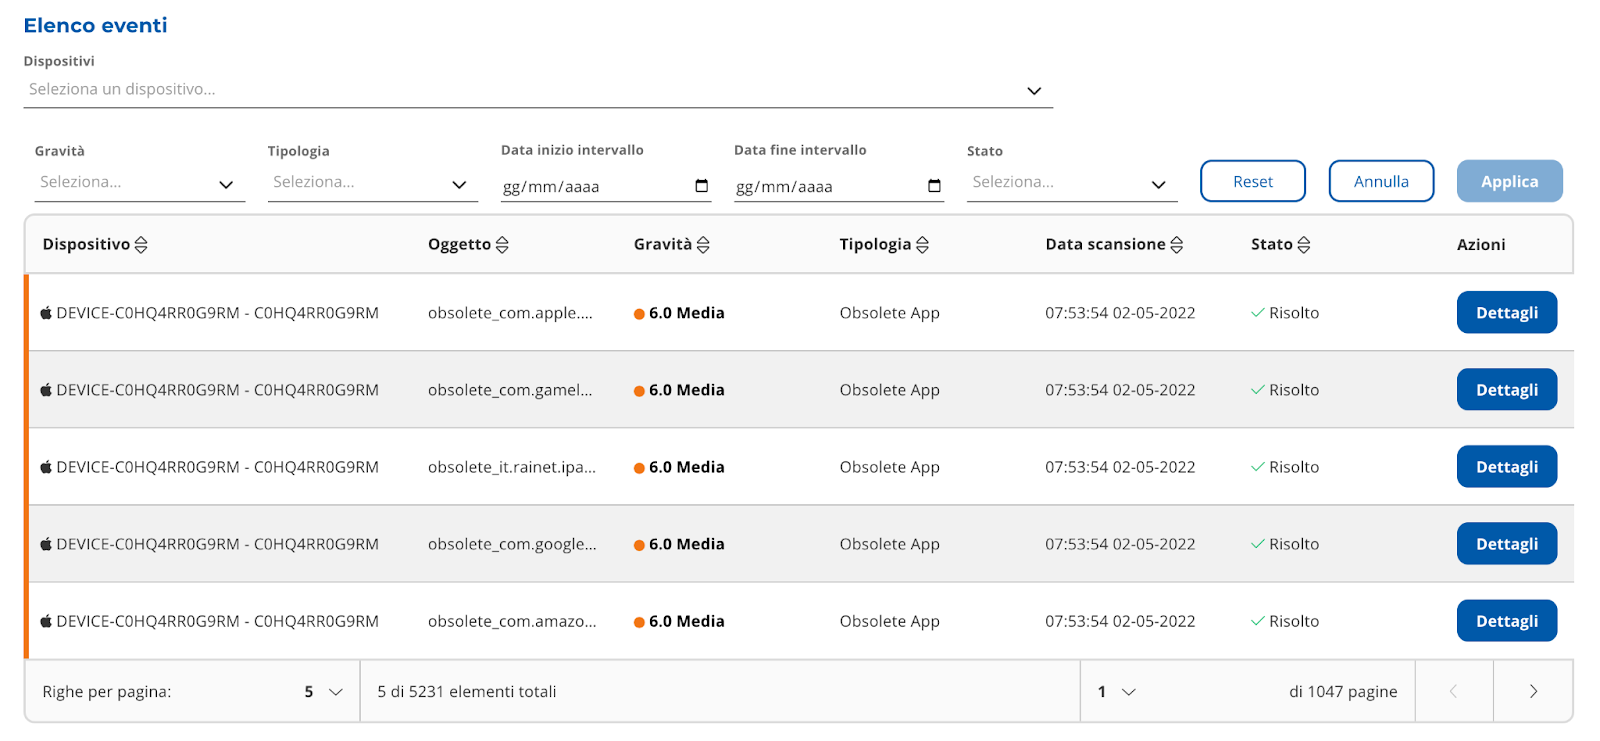
It is a table containing all security events.
The events are classified by severity level and on them it is possible to carry out either the "Repair"
action or set the event as resolved.
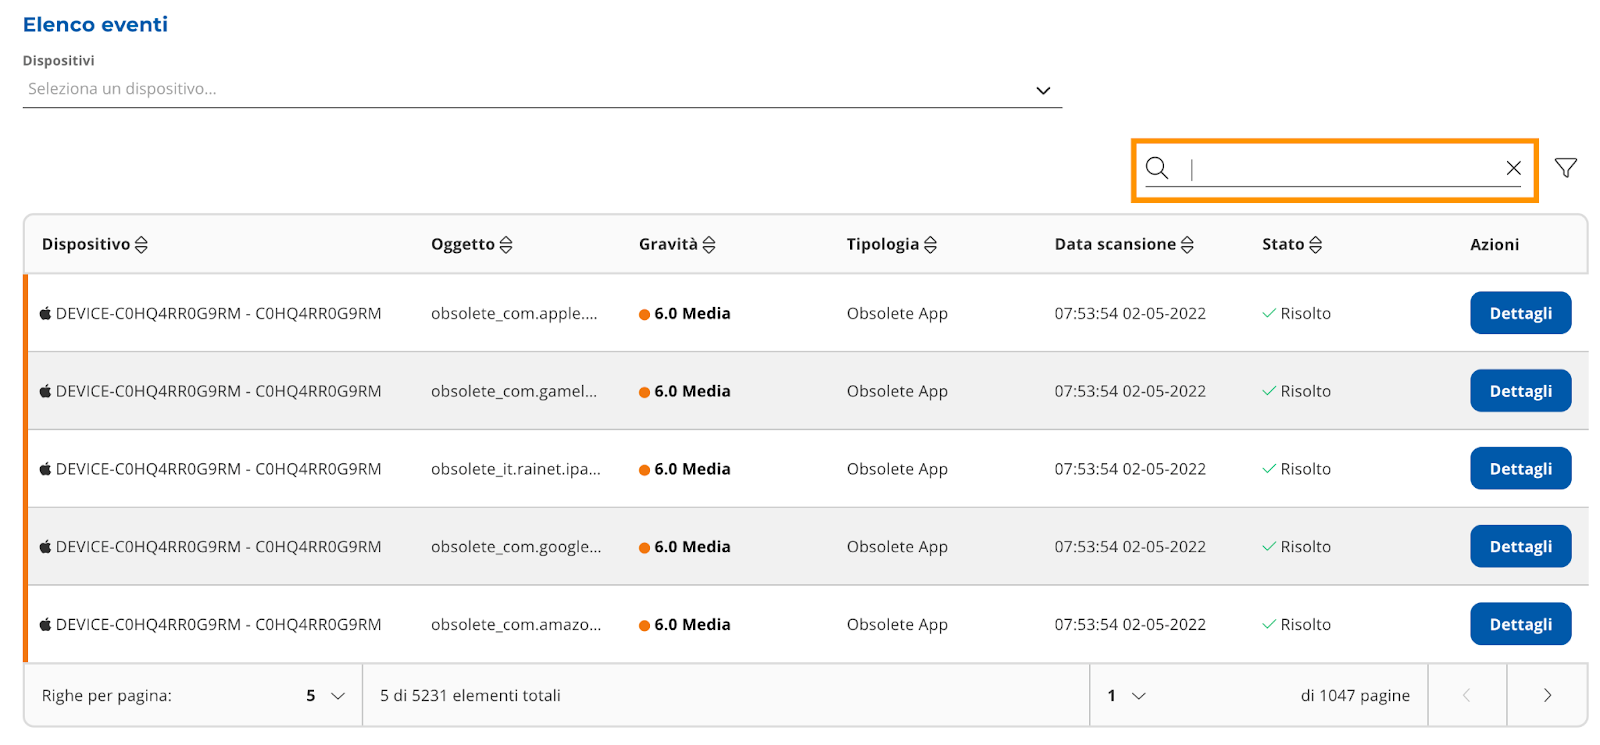
Filters can be applied to the table (Picture 9 and 10) and you can perform free searches (Picture 9 and
11).
 |
|---|
| Image 9 |
 |
|---|
| Image 10 |
 |
|---|
| Image 11 |
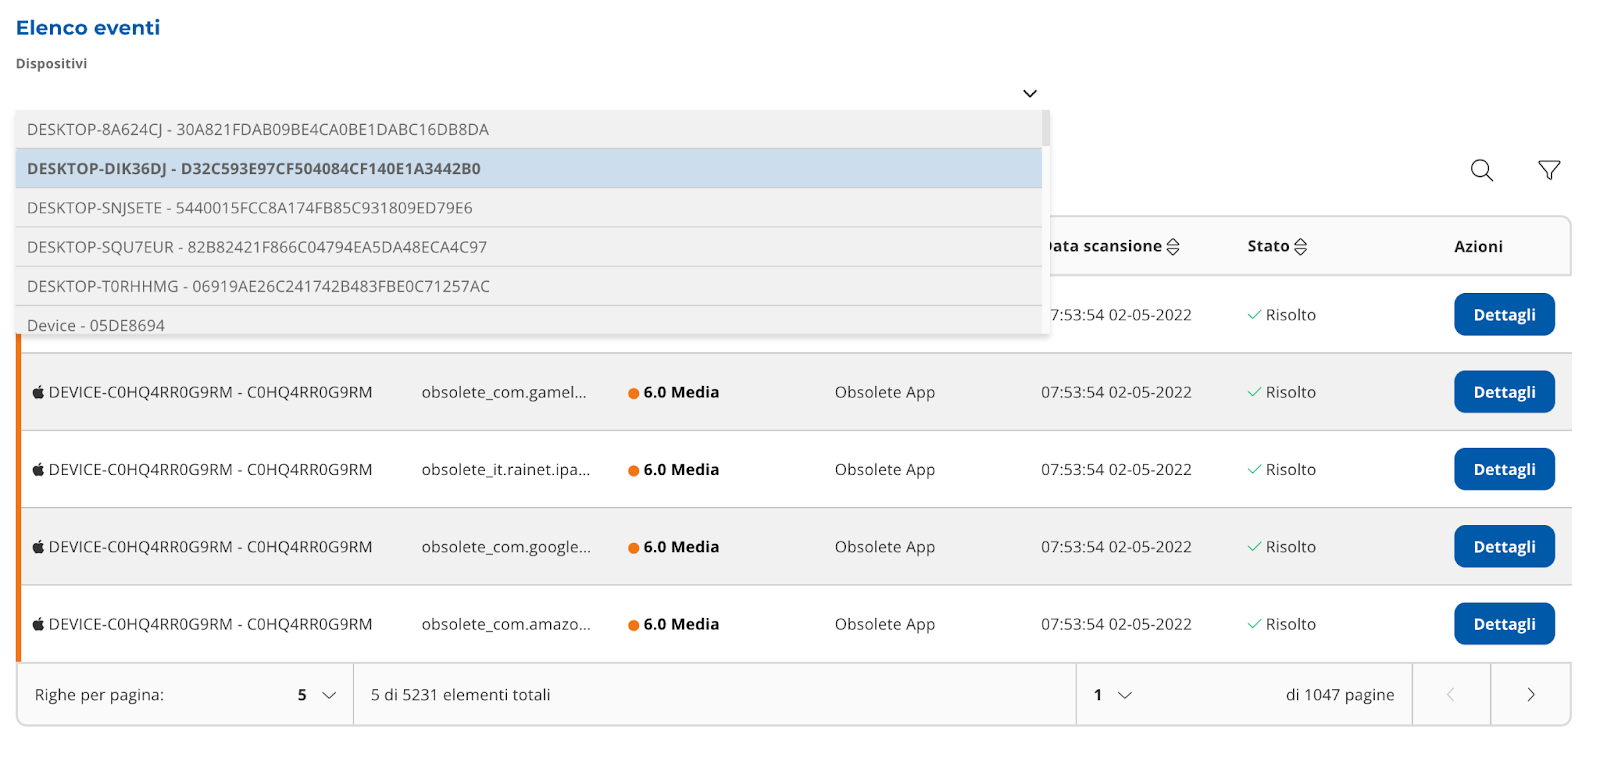
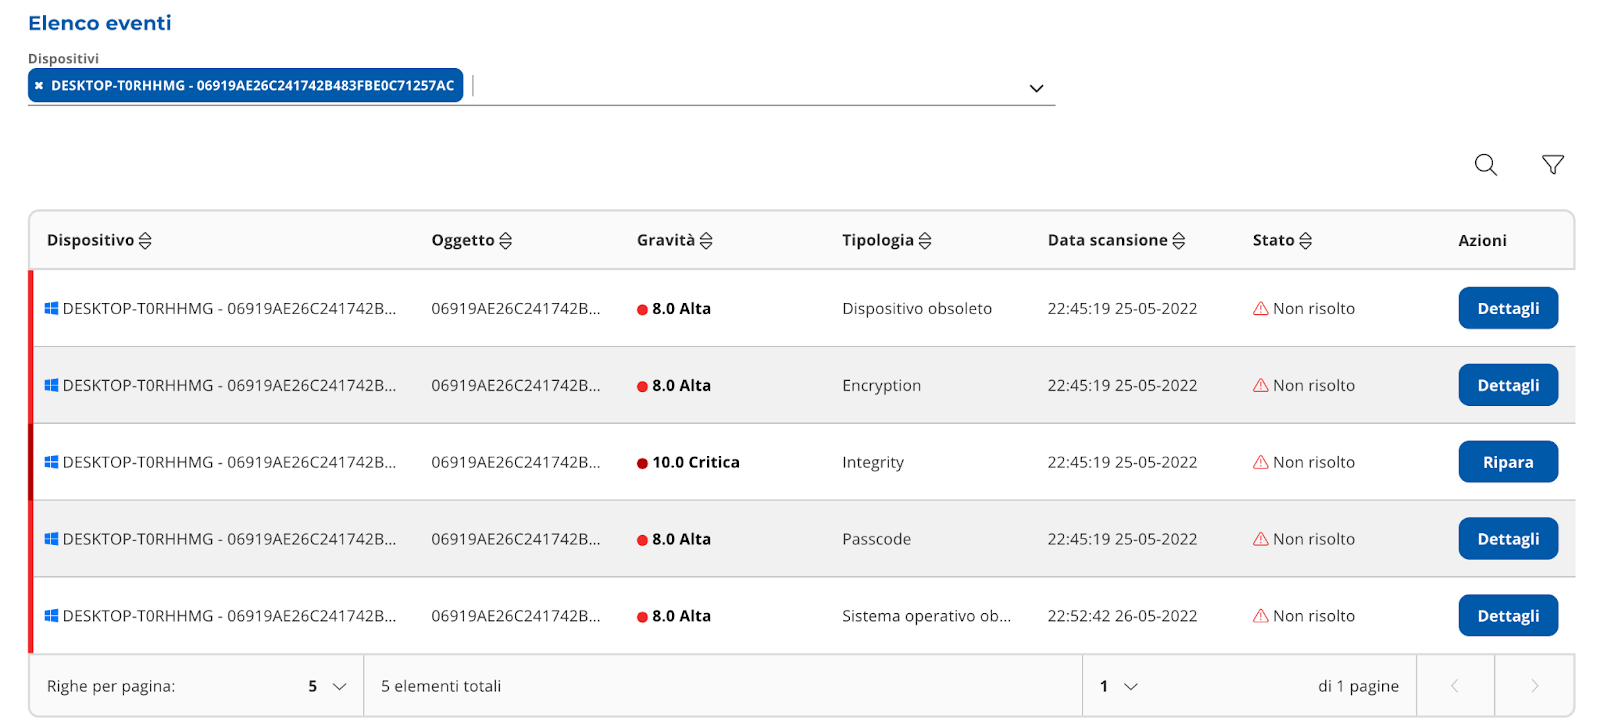
You can filter by device like in Image 12 and 13.
 |
|---|
| Image 12 |
 |
|---|
| Image 13 |
There are two ways of resolving the events in the table:
- Manual mode, the system administrator will have to solve the problem and then through the
"Details" button he can set the security event as solved. - Auto mode, by selecting the button “Repair” you can solve the problem on the device.
Manually set an element as “Solved”
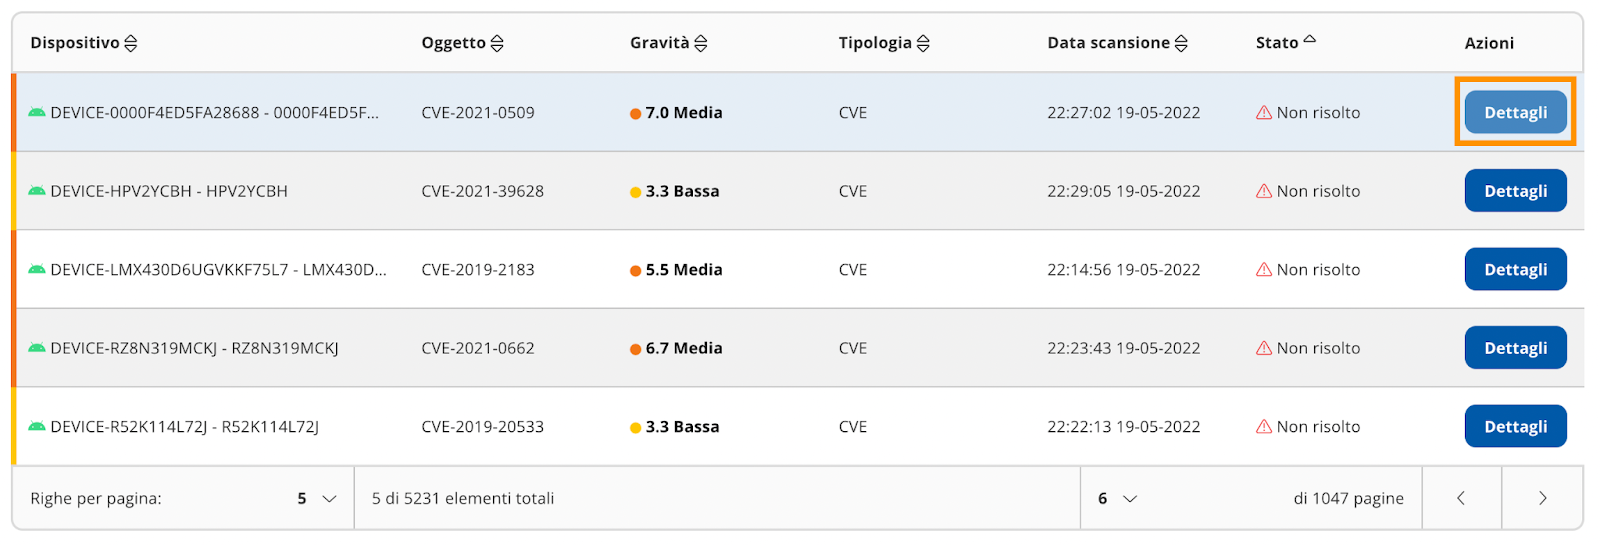
In the "List of events" table, after the administrator has actually solved the problem on the device,
select the event and click on "Details" (Image 14) .
 |
|---|
| Image 14 |
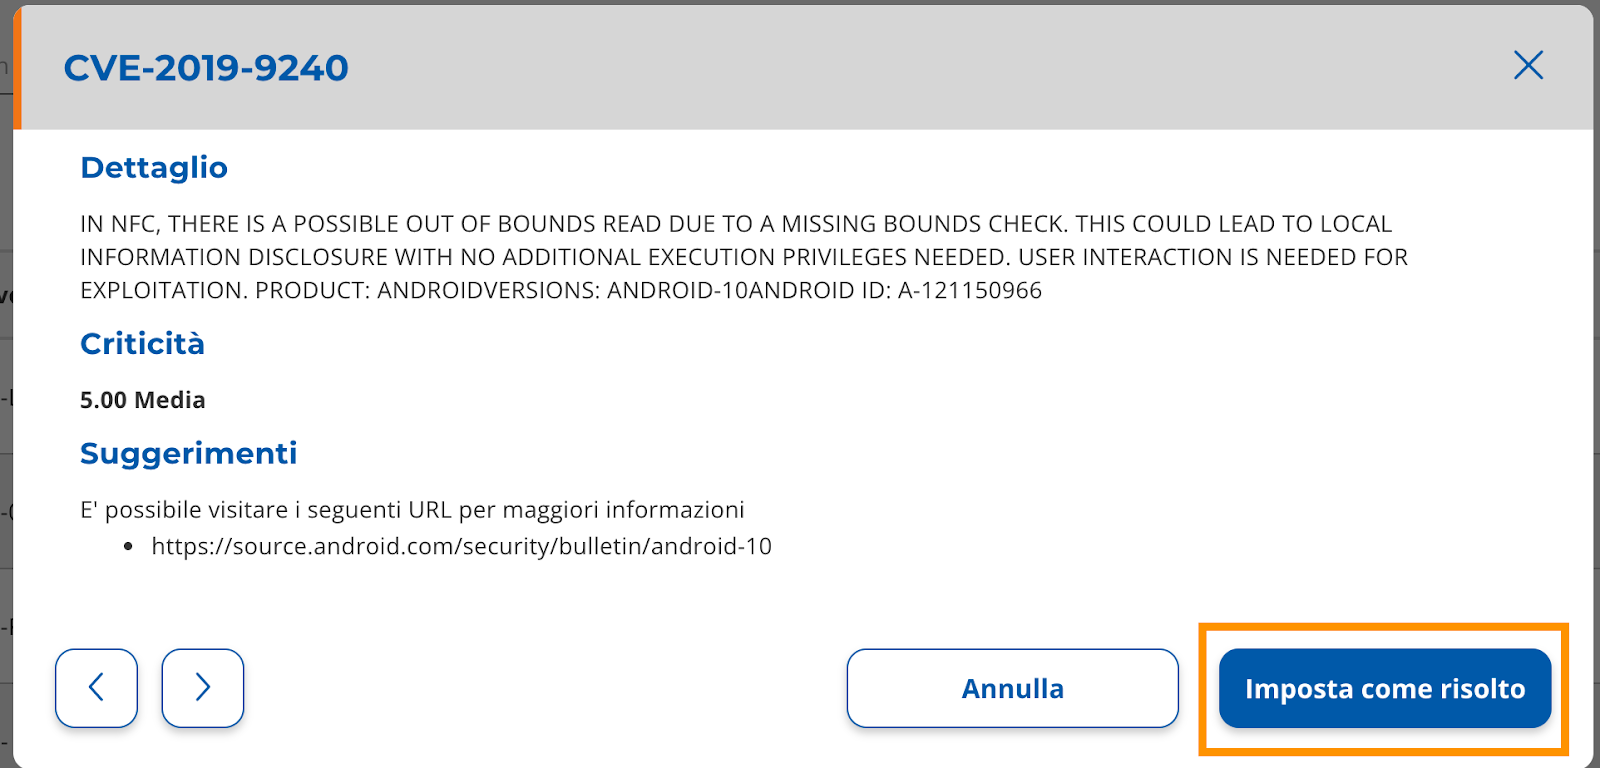
A layer will open and you can now select the button “Set as solved” (Image 15).
 |
|---|
| Image 15 |
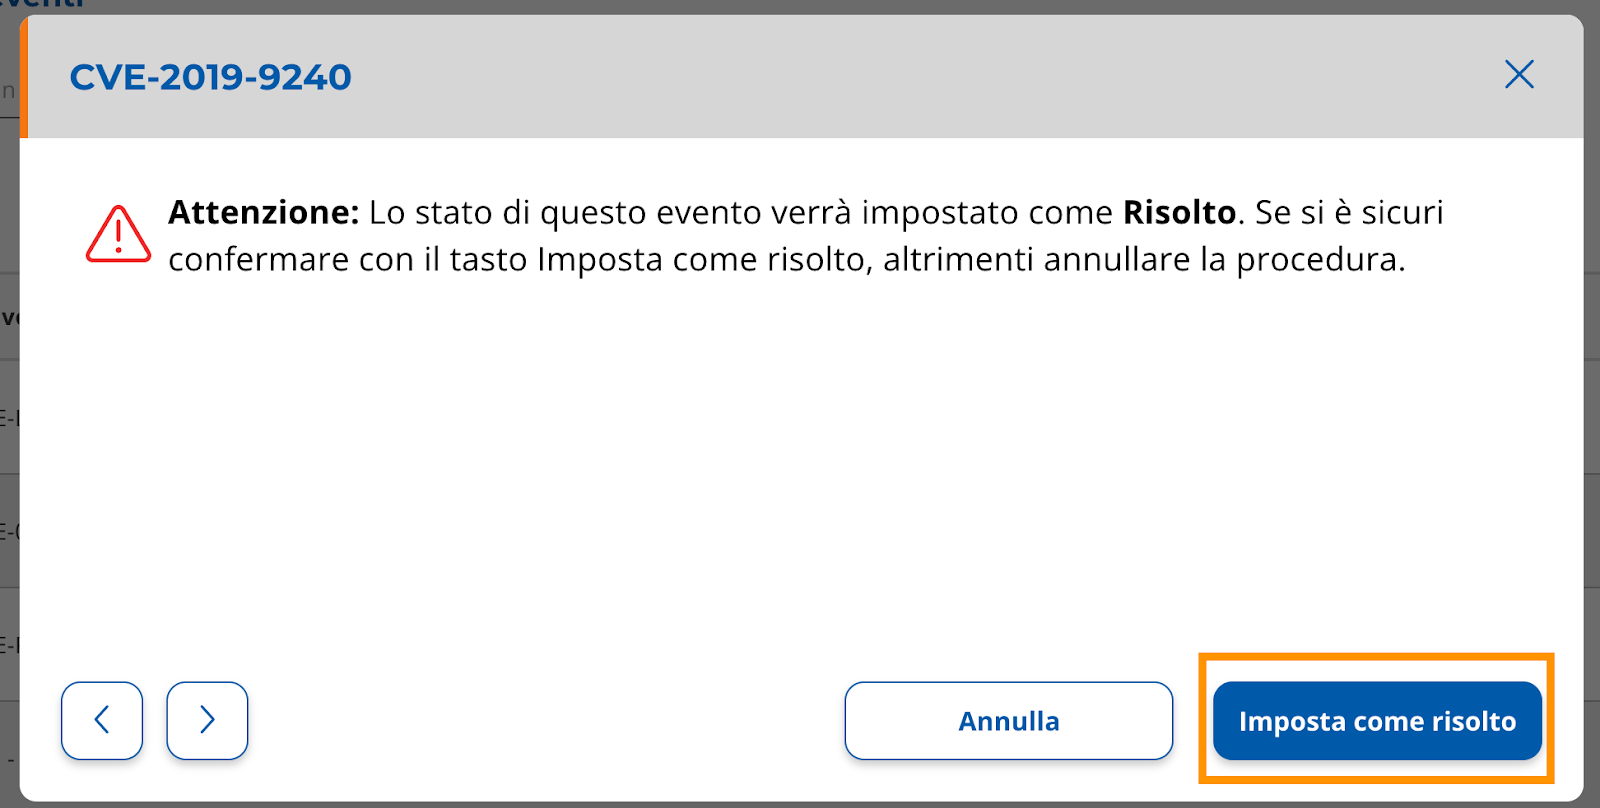
Confirm the operation by selecting the "Set as solved" button after reading the message carefully
(Image 16).
 |
|---|
| Image 16 |
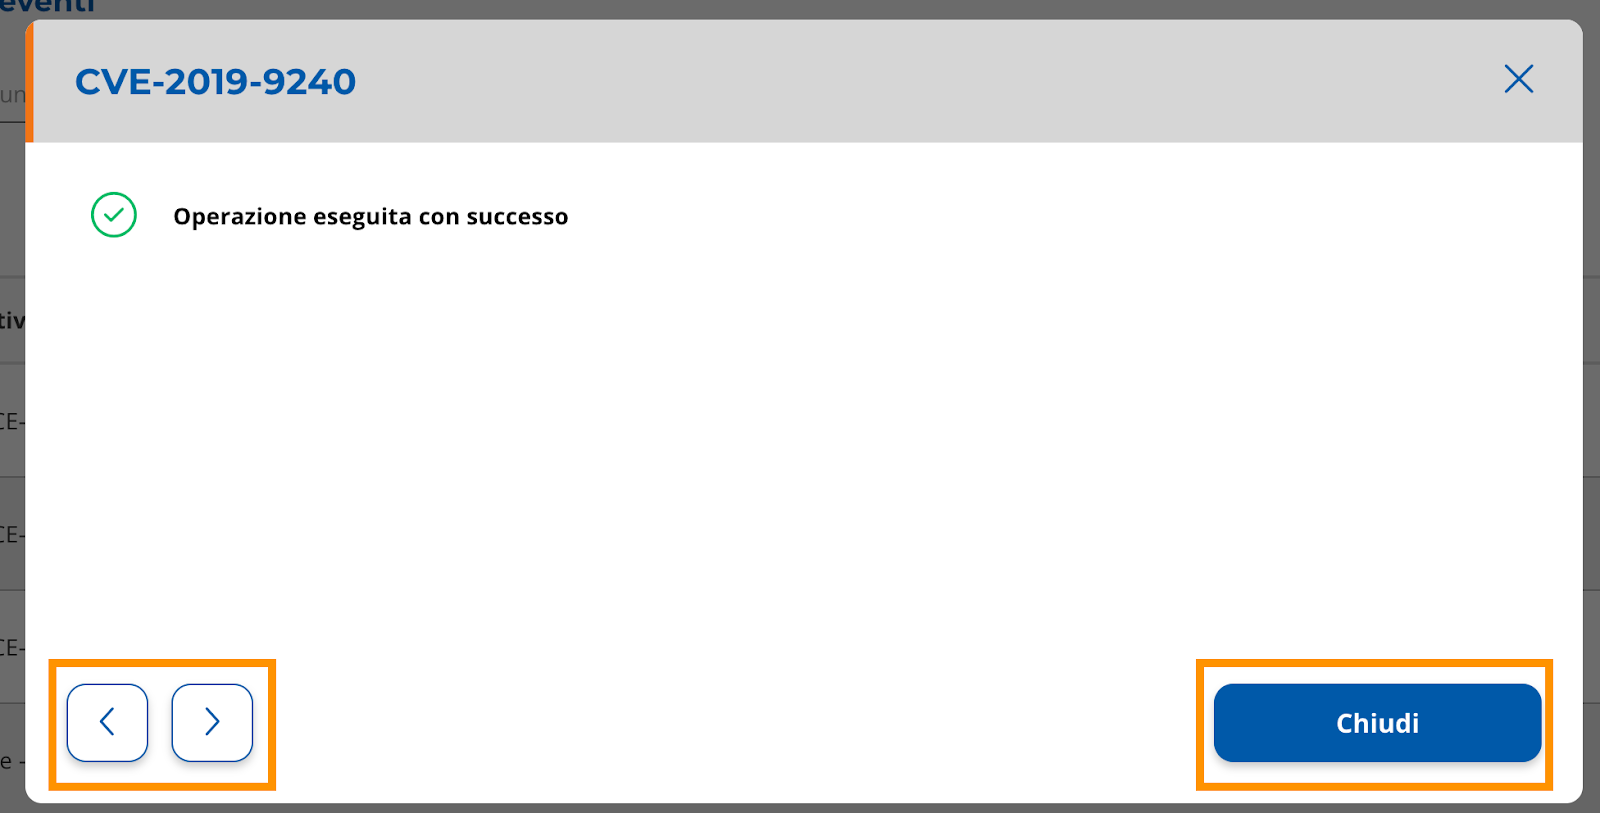
Conclusion of the operation with feedback (Image 17); at this point you can decide whether to close
the layer or operate on other events (arrows at the bottom left).
 |
|---|
| Image 17 |
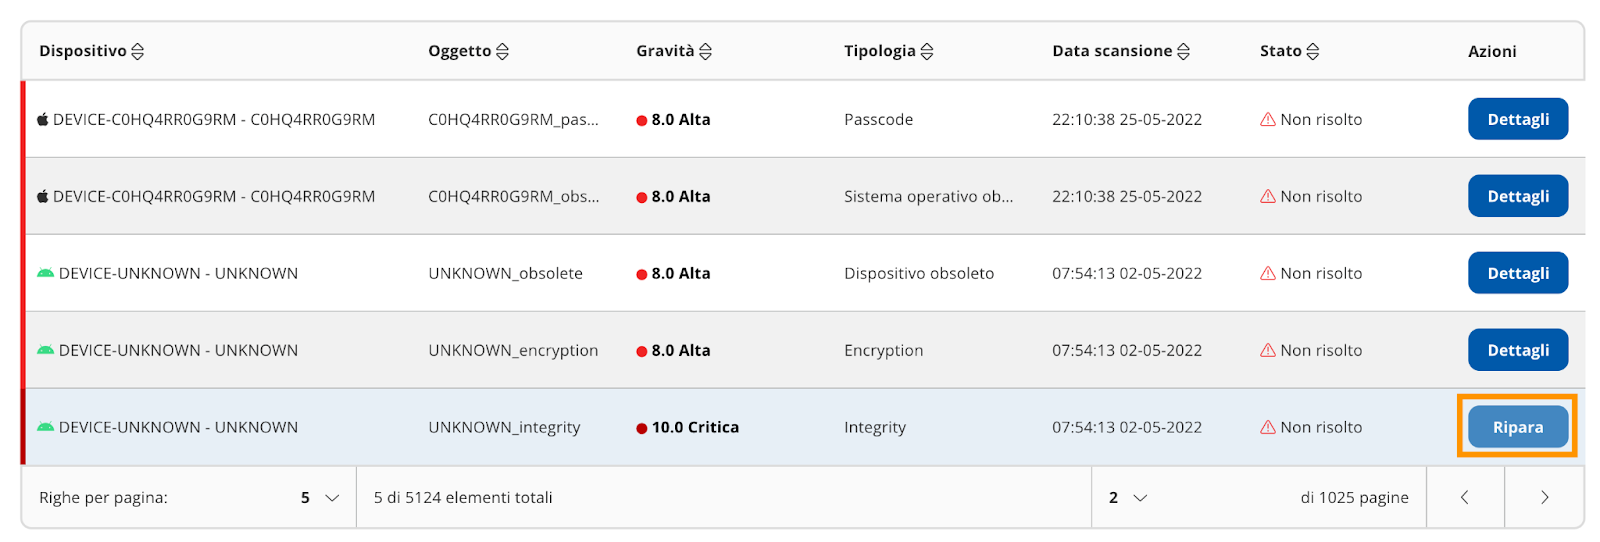
Solve security event with automatic procedure
In the table after choosing which device and event to repair, select the "Repair" button (Image 18) .
 |
|---|
| Image 18 |
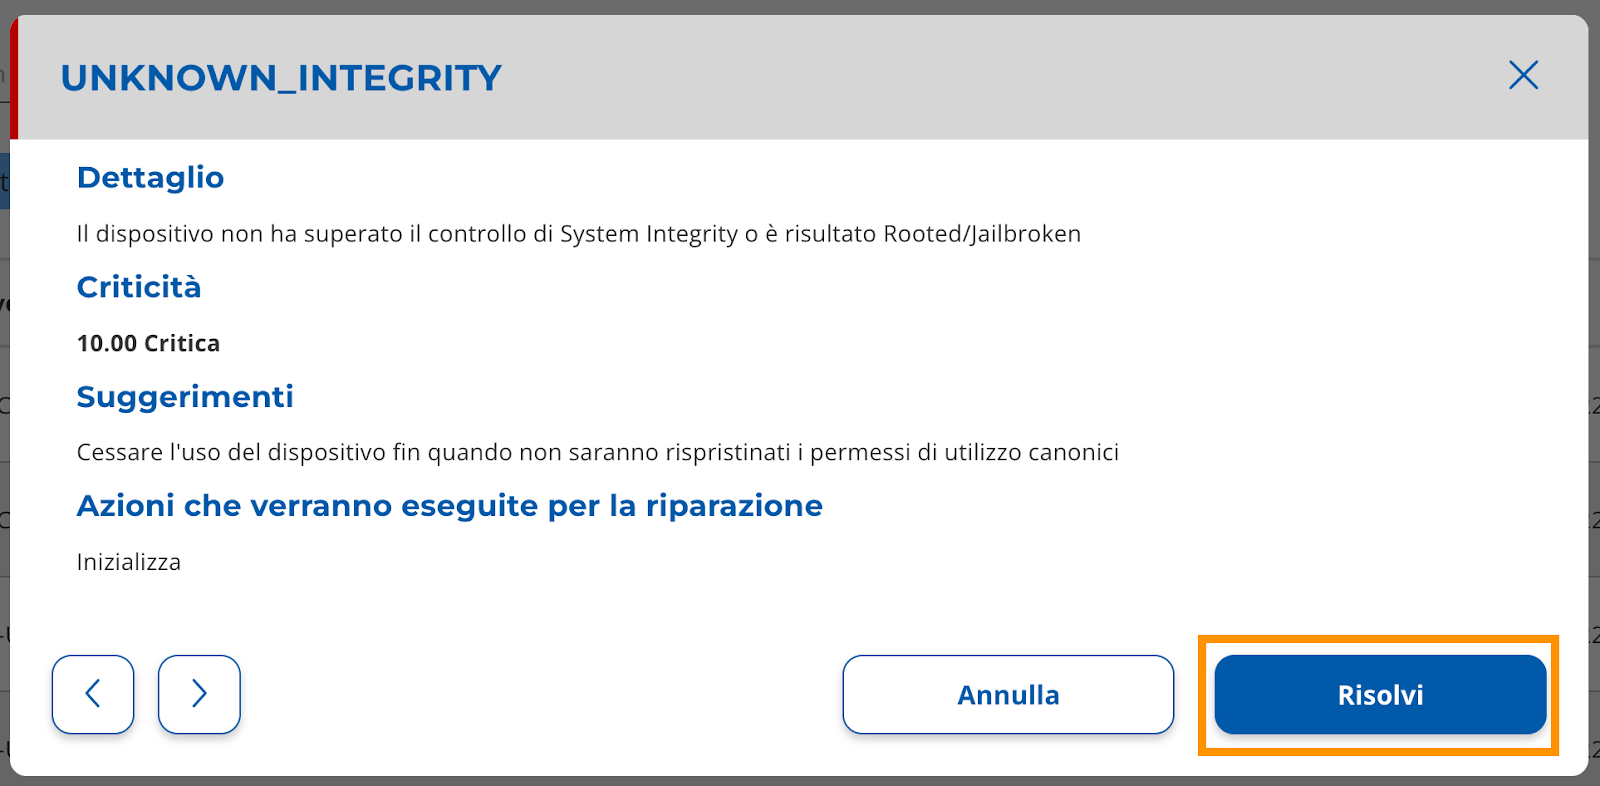
An overlay screen will open: carefully read the details of the automatic resolution action and select
the "Solve" button (Image 19).
 |
|---|
| Image 19 |
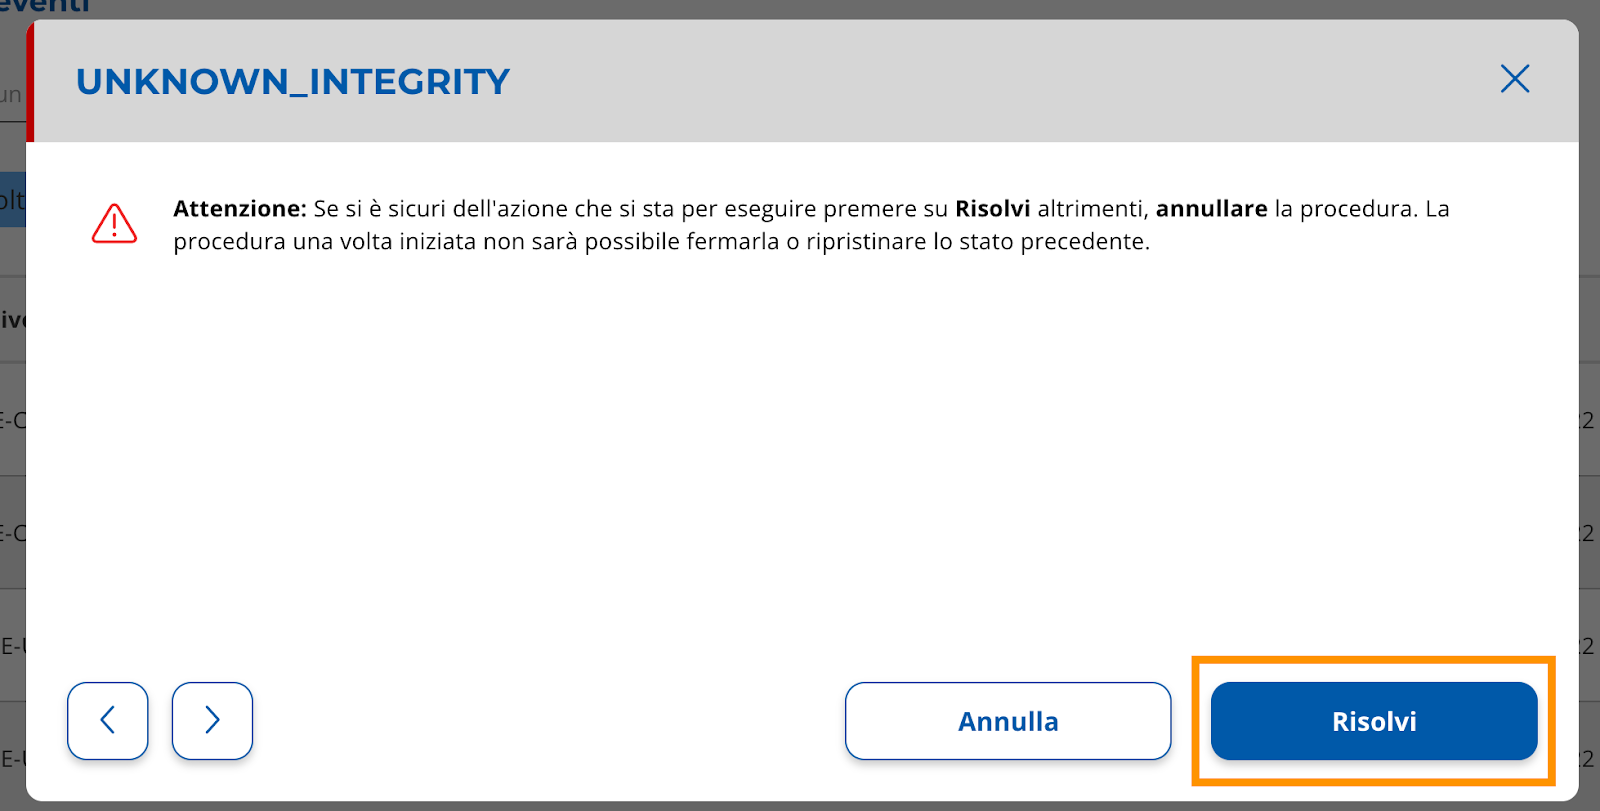
Confirm the operation by clicking the “Solve” button (Image 20).
 |
|---|
| Image 20 |
Conclusion of the operation with feedback (Image 21); at this point you can decide to close the layer
or operate on other events (arrows at the bottom left).
 |
|---|
| Image 21 |
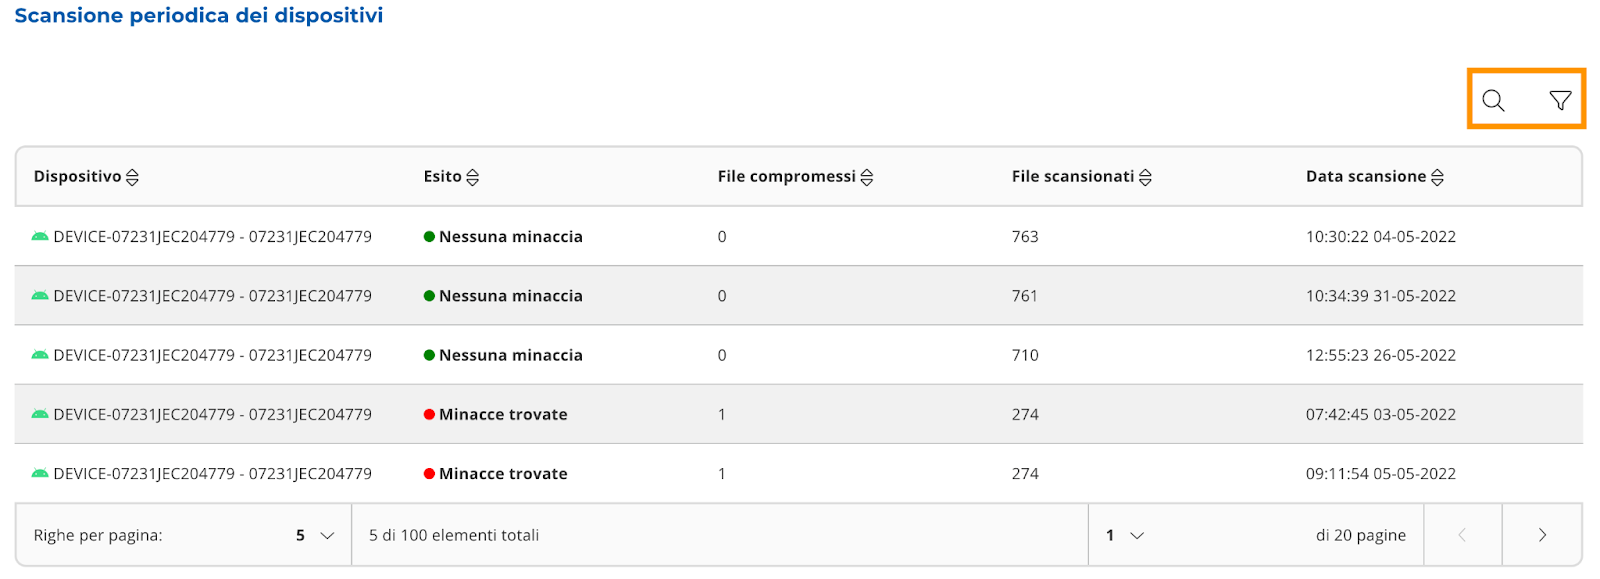
“Periodic scan of devices”
It is a table containing the results of scans on the device file system.
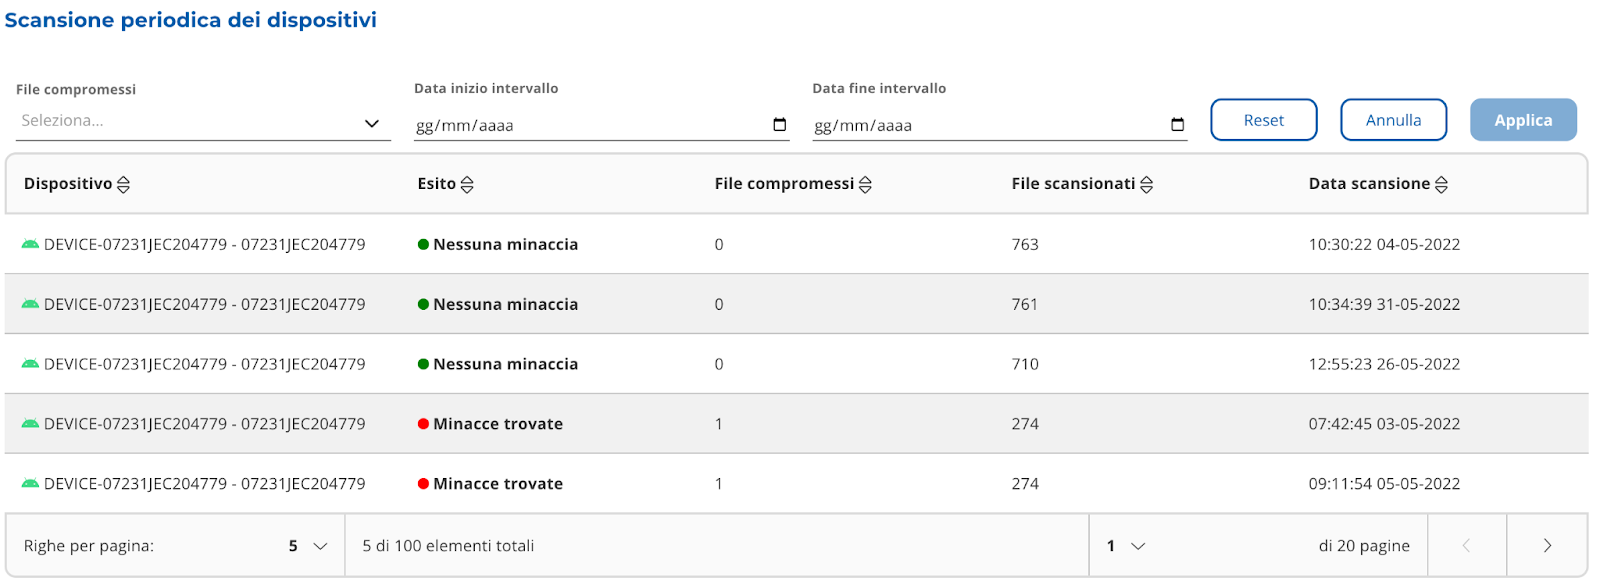
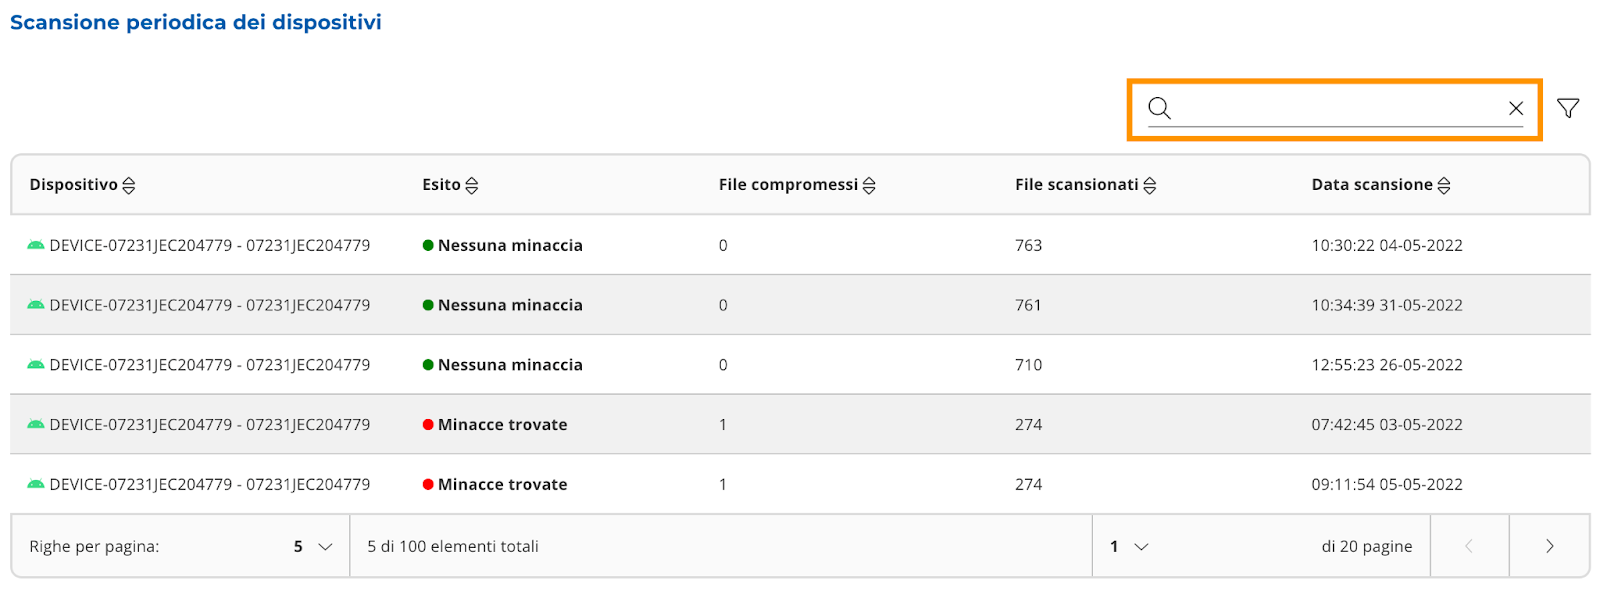
The scans are divided into “No threats” and “Threats found”. You can apply filters to the table (Image
22 and 23), and perform free searches (Image 22 and 24).
 |
|---|
| Image 22 |
 |
|---|
| Image 23 |
 |
|---|
| Image 24 |
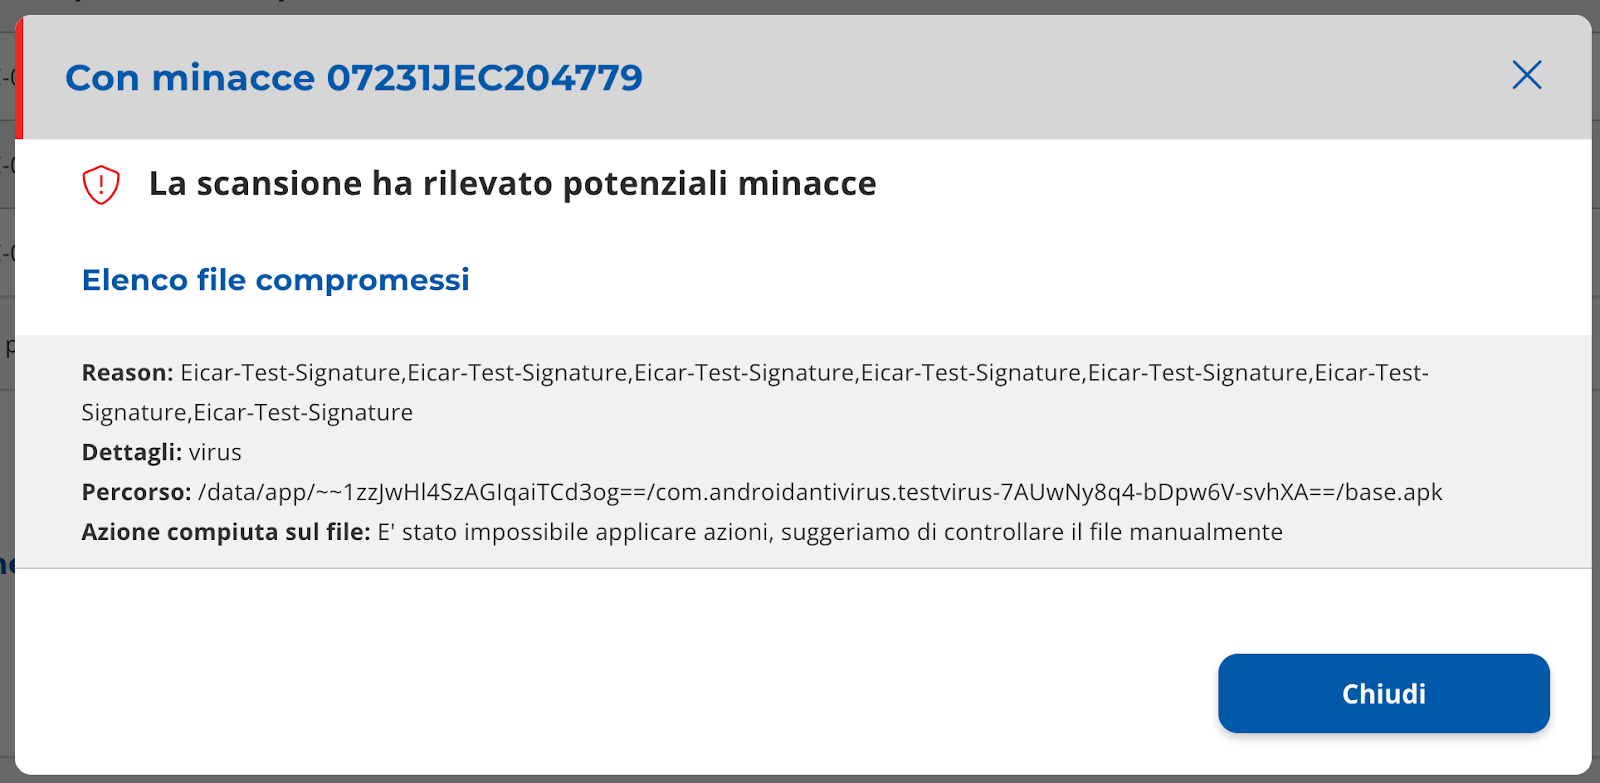
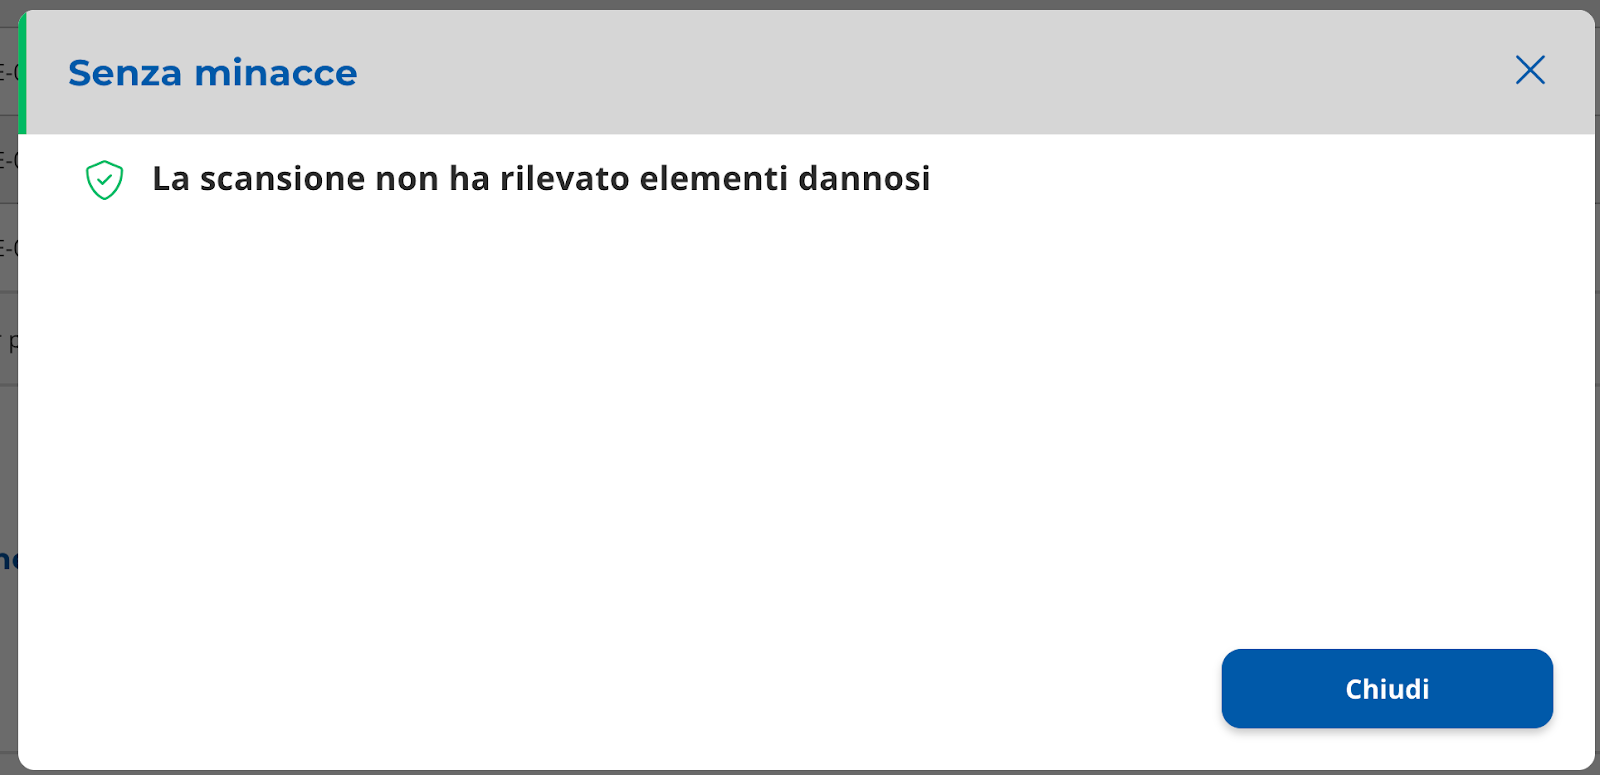
It is possible to view the scan details by selecting the row of the table.
The layer with the detail will open (Immagine 25 e 26).
 |
|---|
| Image 25 |
 |
|---|
| Image 26 |
“Scan on demand”
It is a table (Image 27)
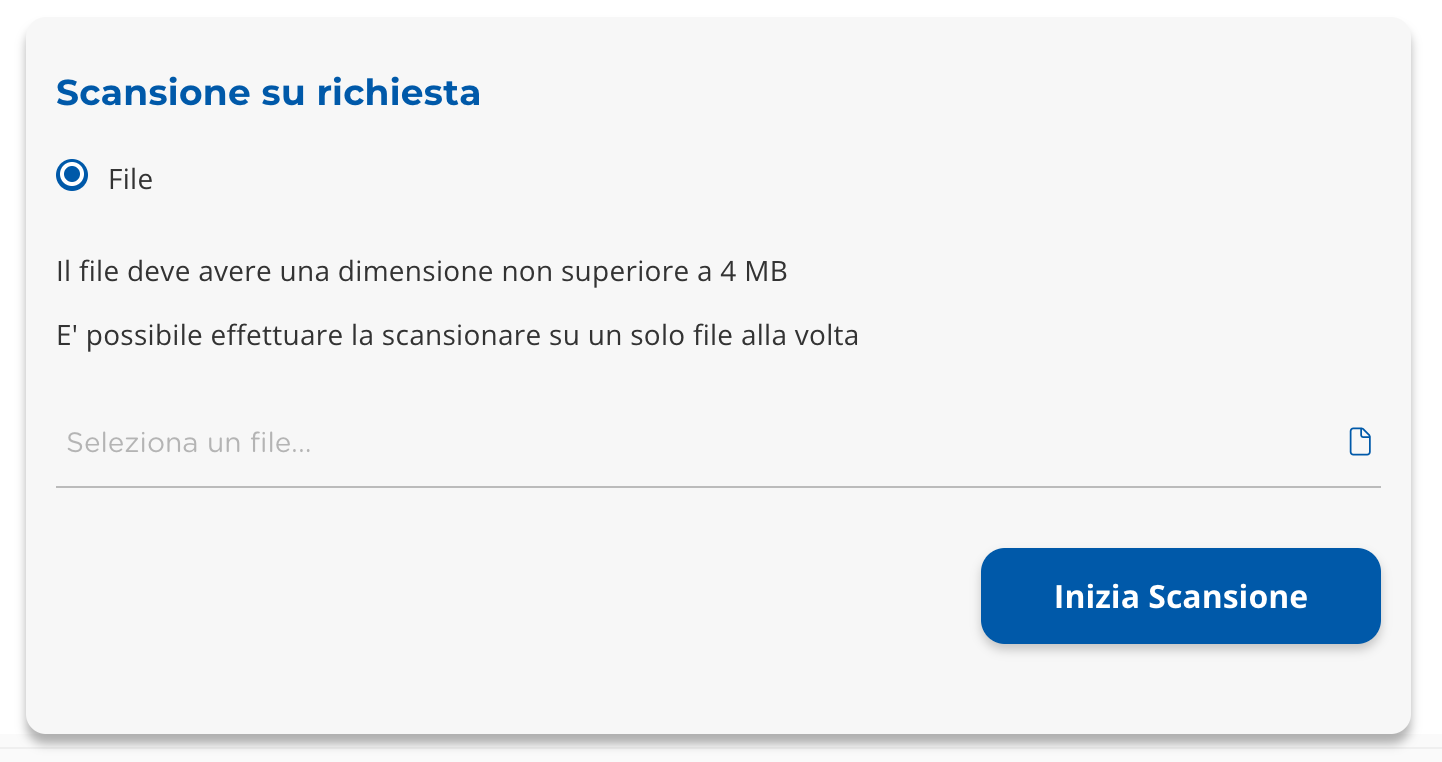
containing the results of the scans carried out through the “Scan upon request” widget (Image 28).
 |
|---|
| Image 27 |
 |
|---|
| Image 28 |
The scans are divided into “No threats” and “Threats found”.
You can apply filters to the table (Image 29 and 30), perform free searches (Image 29 and 31).
 .png) .png) |
|---|
| Image 29 |
 |
|---|
| Image 30 |
 .png) .png) |
|---|
| Image 31 |
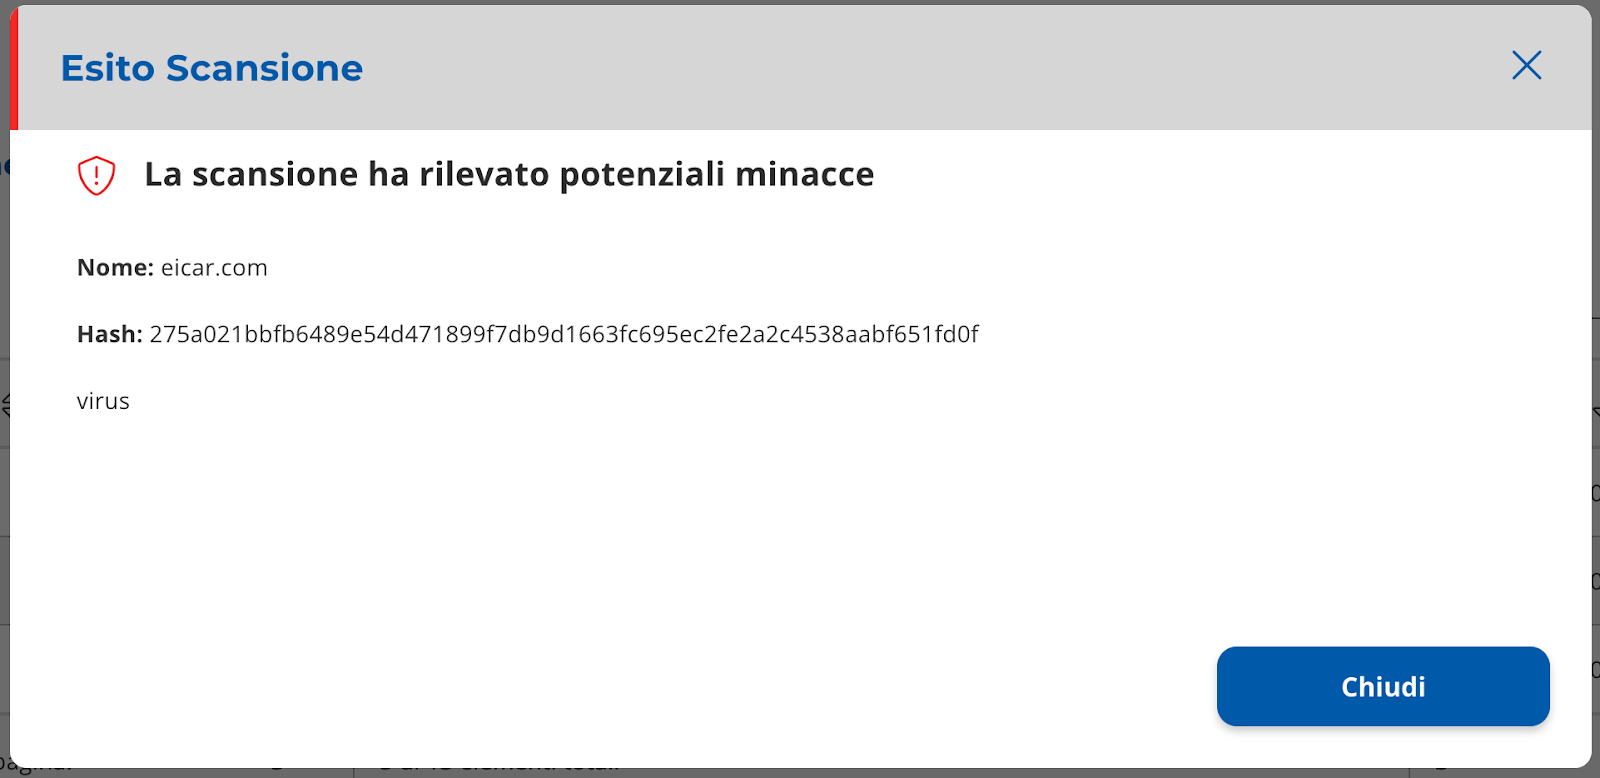
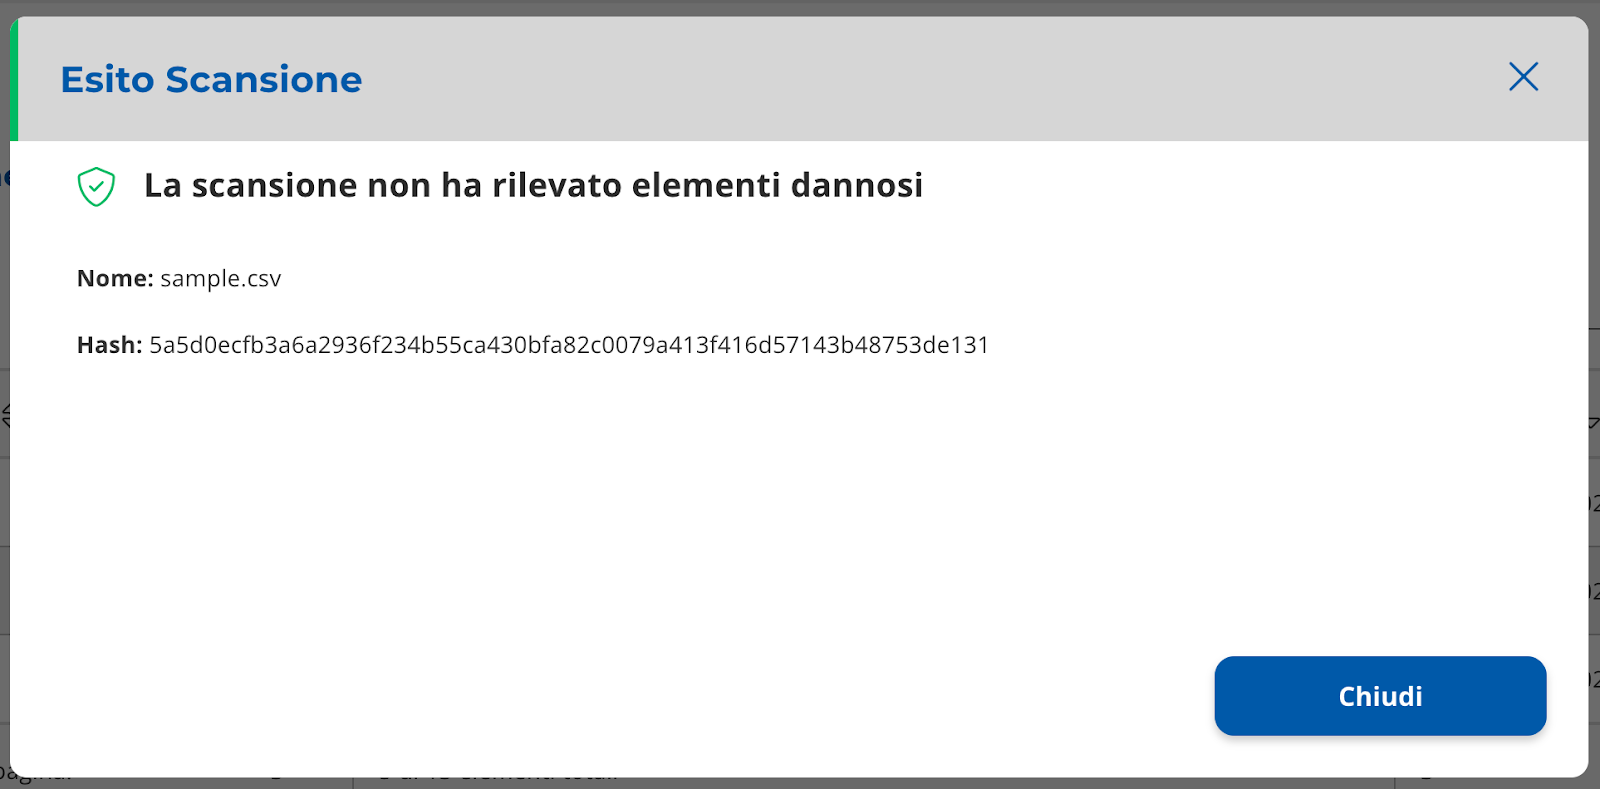
It is possible to view the scan details by selecting the row of the table.
The layer with the detail will open (Image 32 and 33).
 |
|---|
| Image 32 |
 |
|---|
| Image 33 |
“Scan on demand” widget
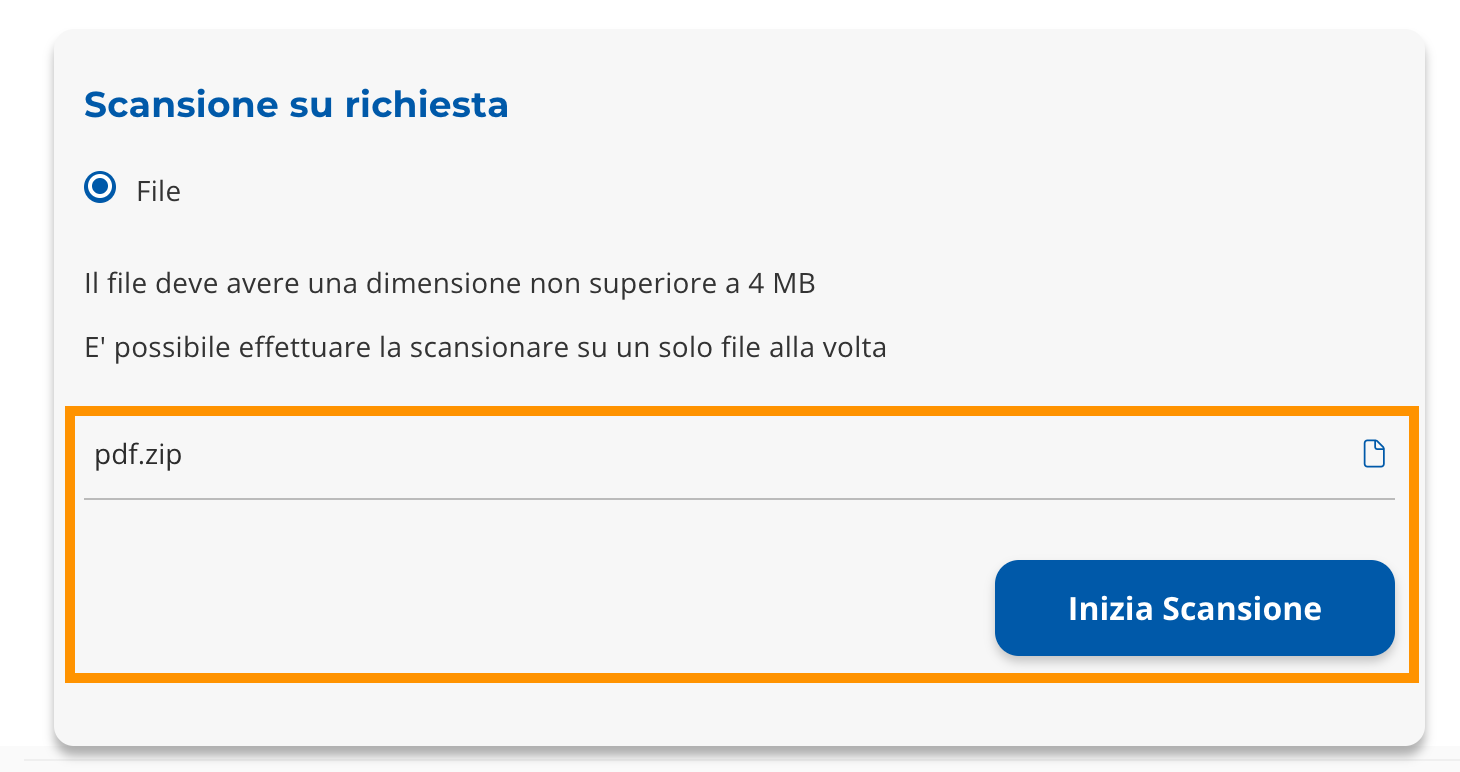
It is possible to carry out scans to check if there are harmful elements in a file with a size not exceeding 4MB.
Select the input box to choose the file to scan.
Once the file has been uploaded, click on "Start Scan" (Image 34).
 |
|---|
| Image 34 |
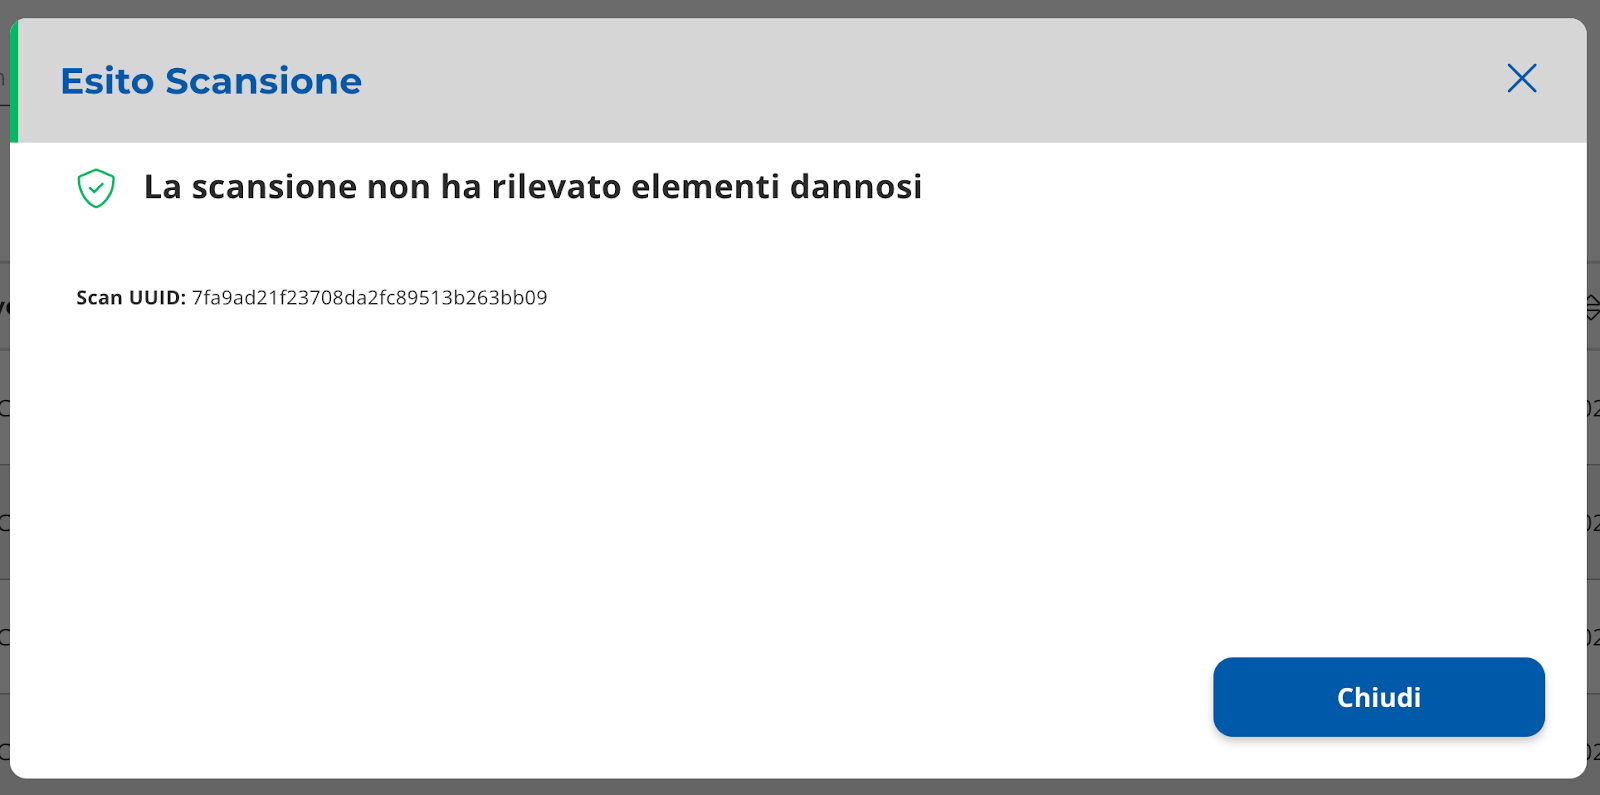
After a few moments, a layer with the result will appear (Image 35).
The result will also be viewable from the “Scan upon request” table.
 |
|---|
| Image 35 |
